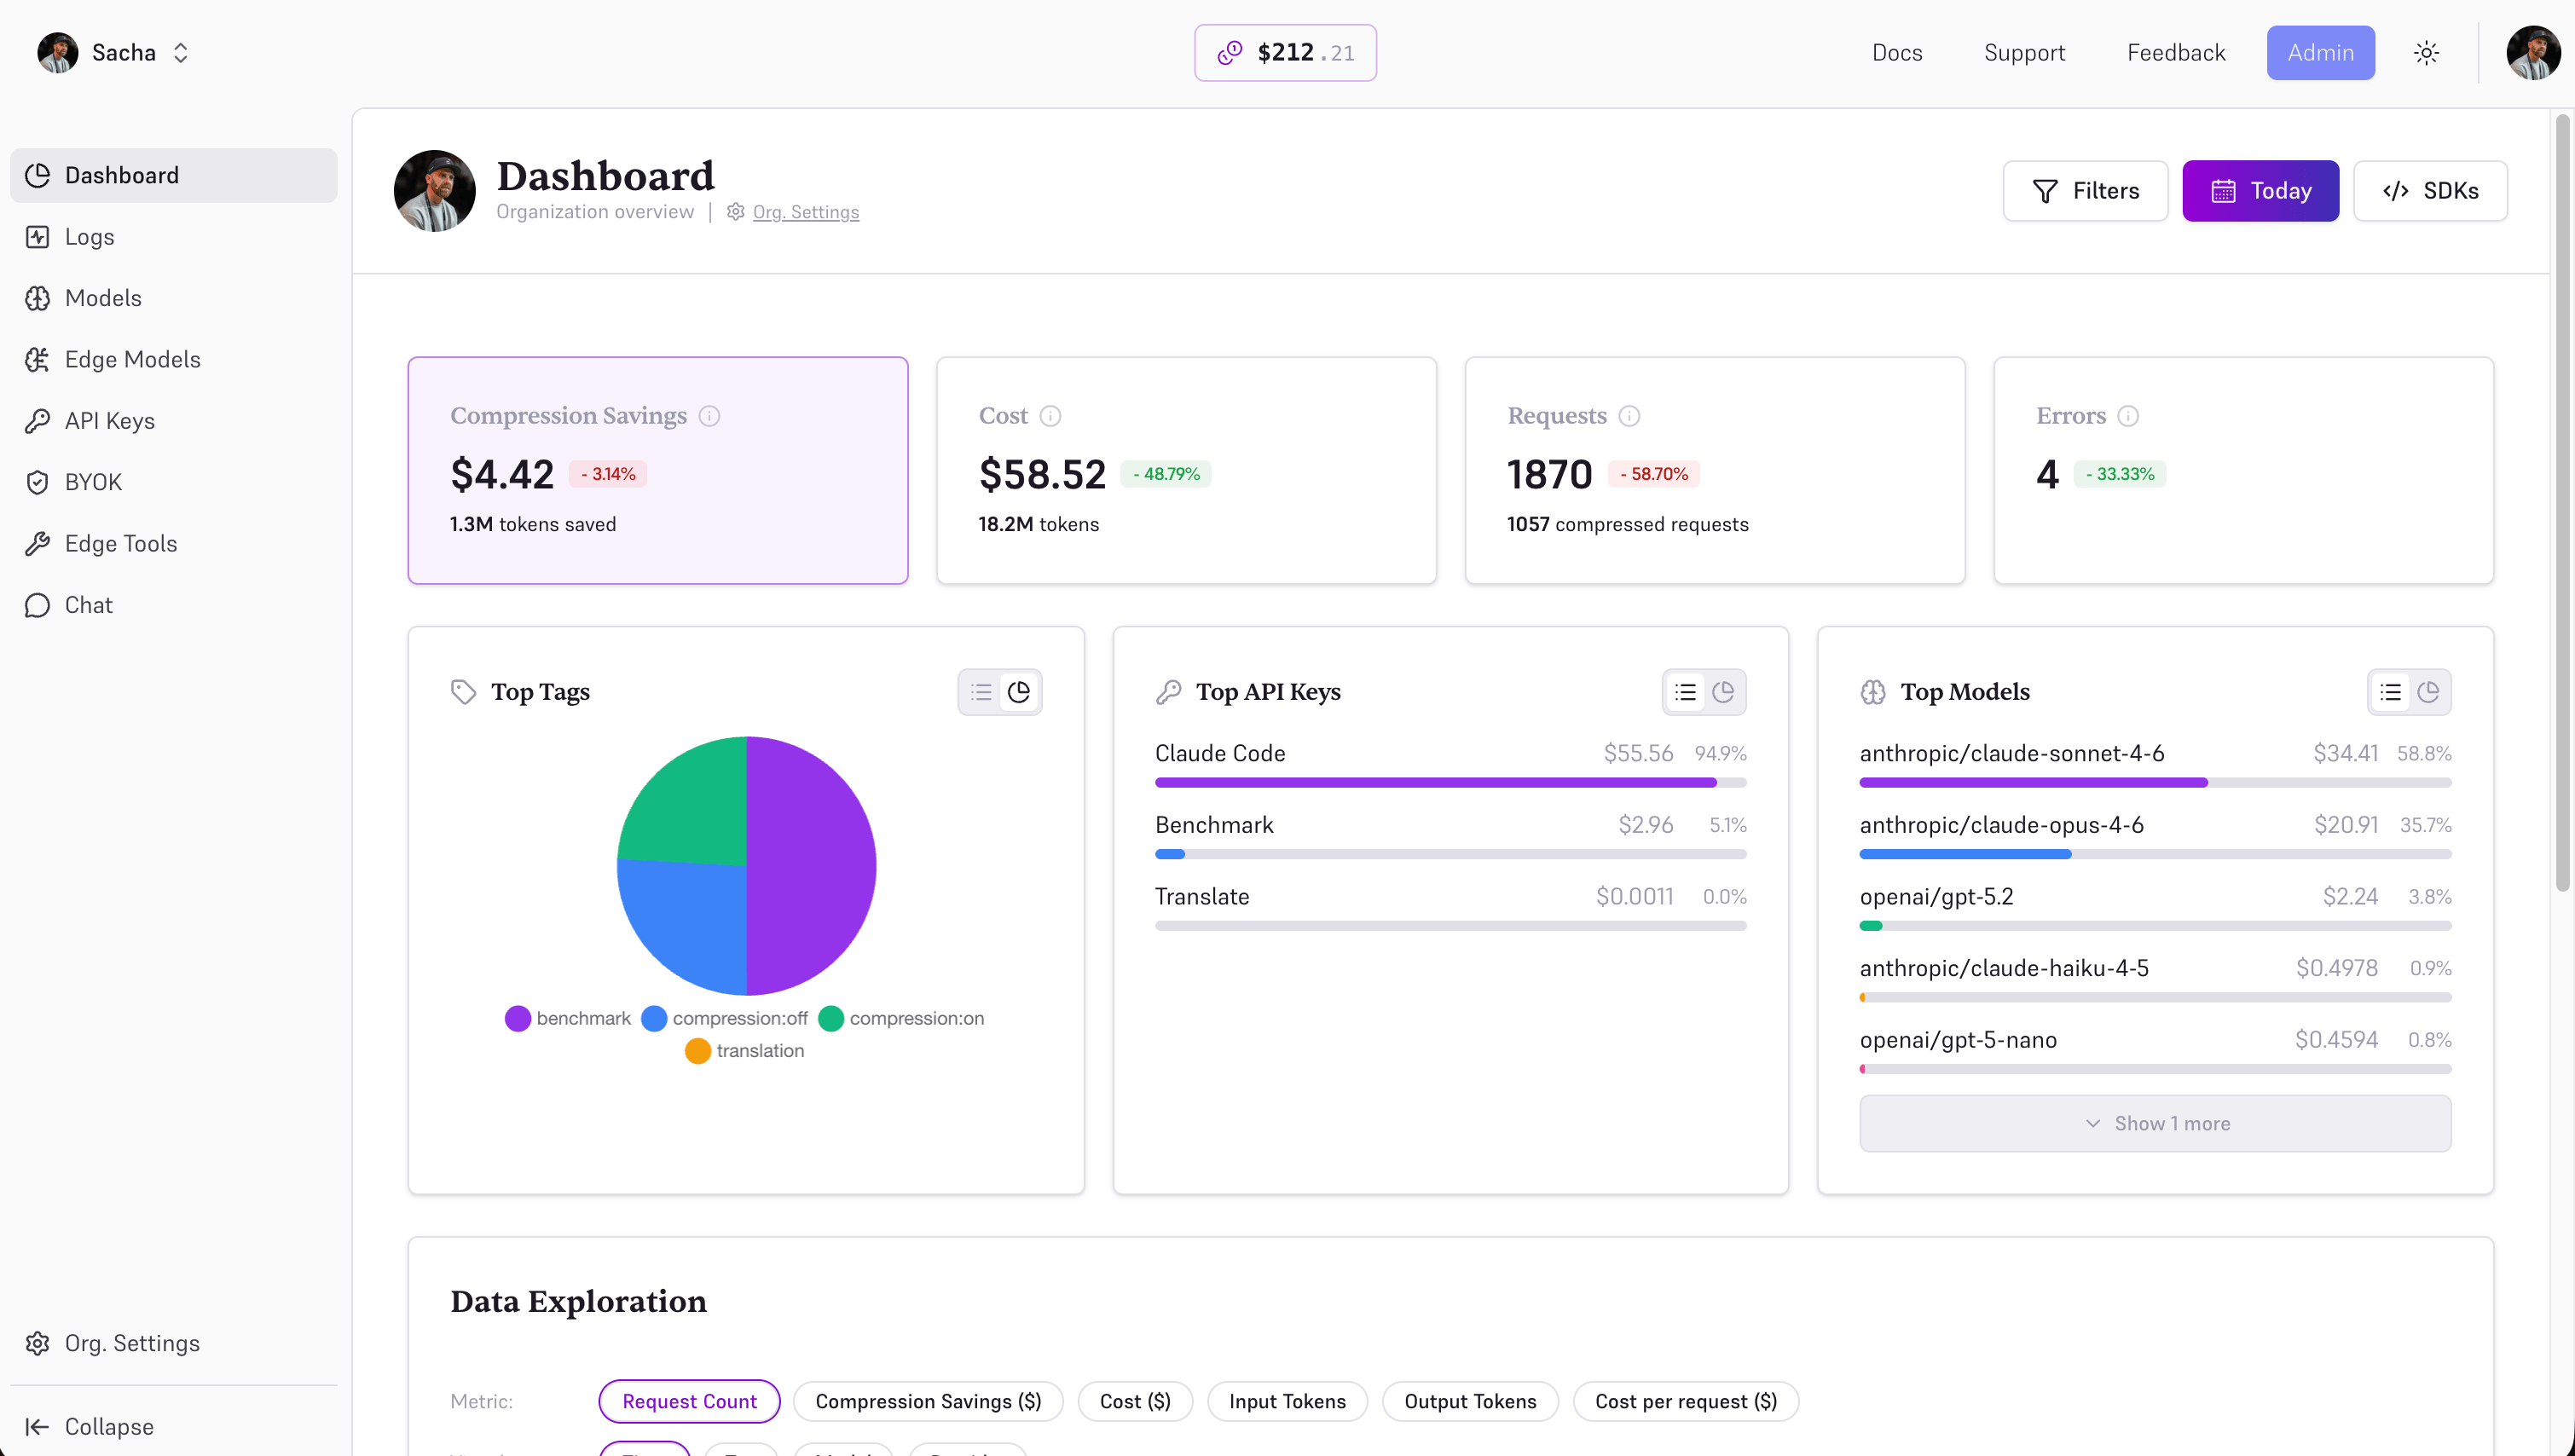
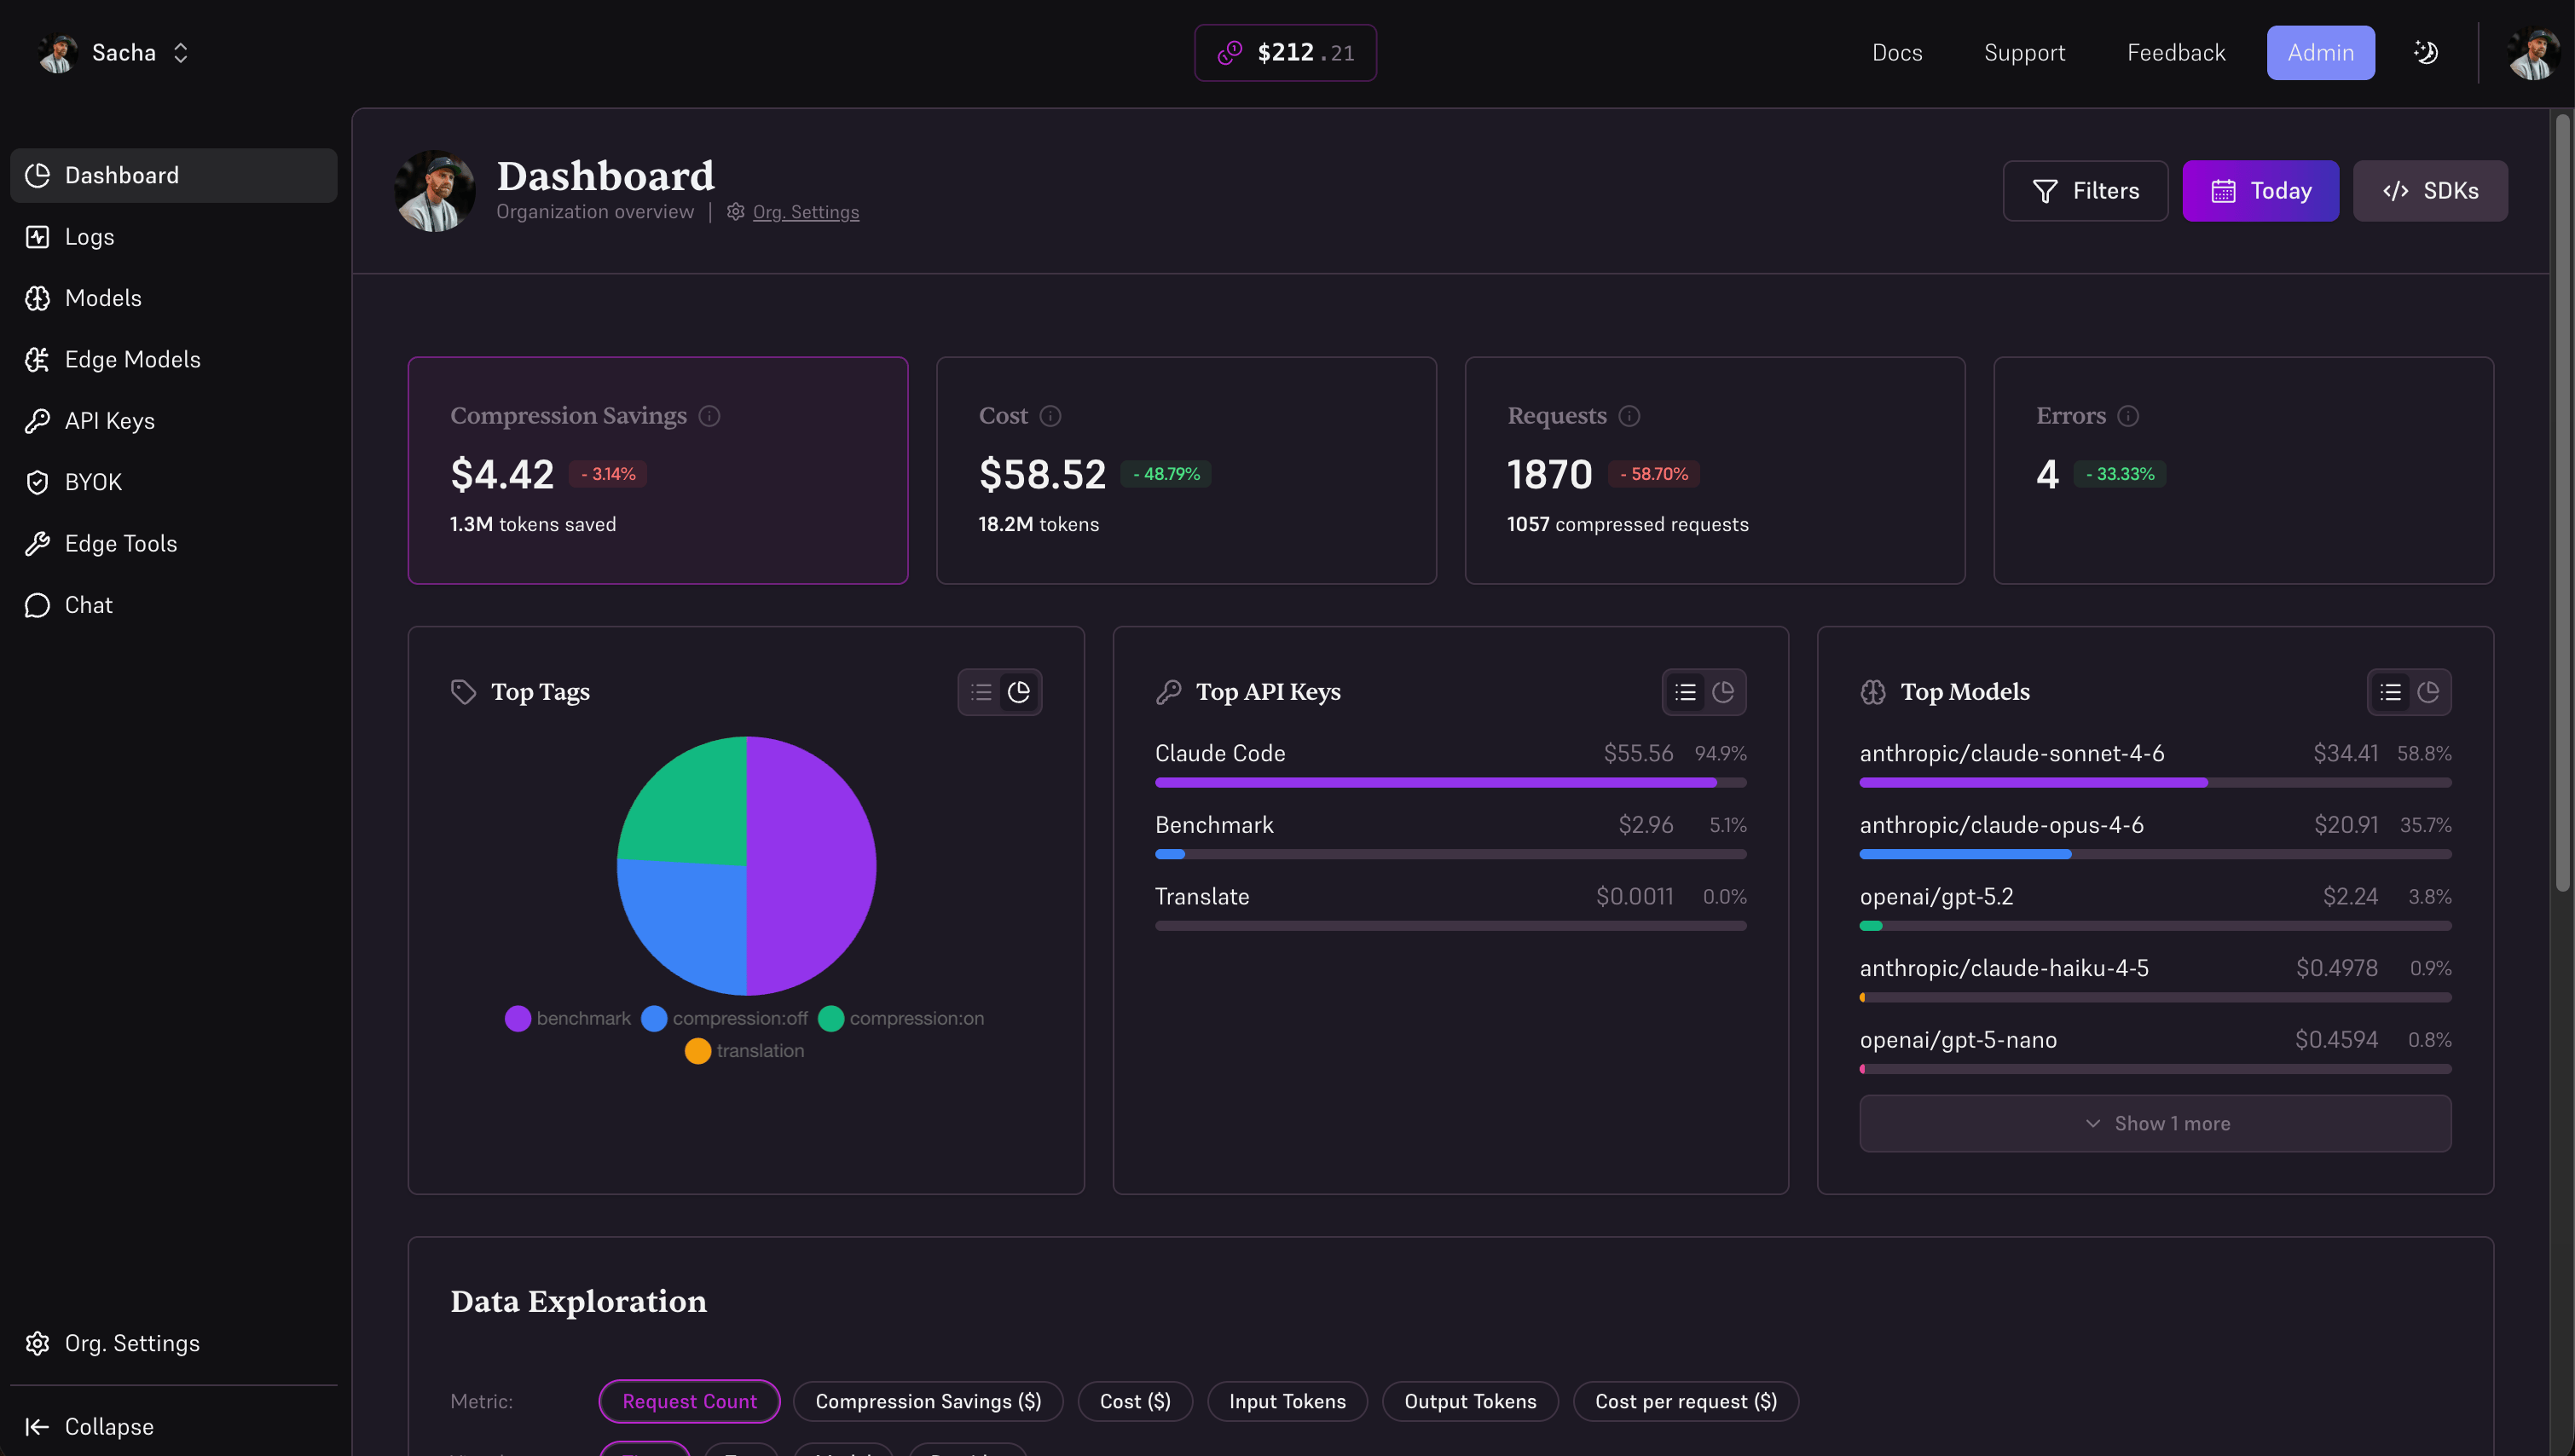
Track every request, measure every token, optimize every dollar.
Measuring every token, every request, every compression event, every routing decision, at session level locally and at team level in the managed Edgee console.
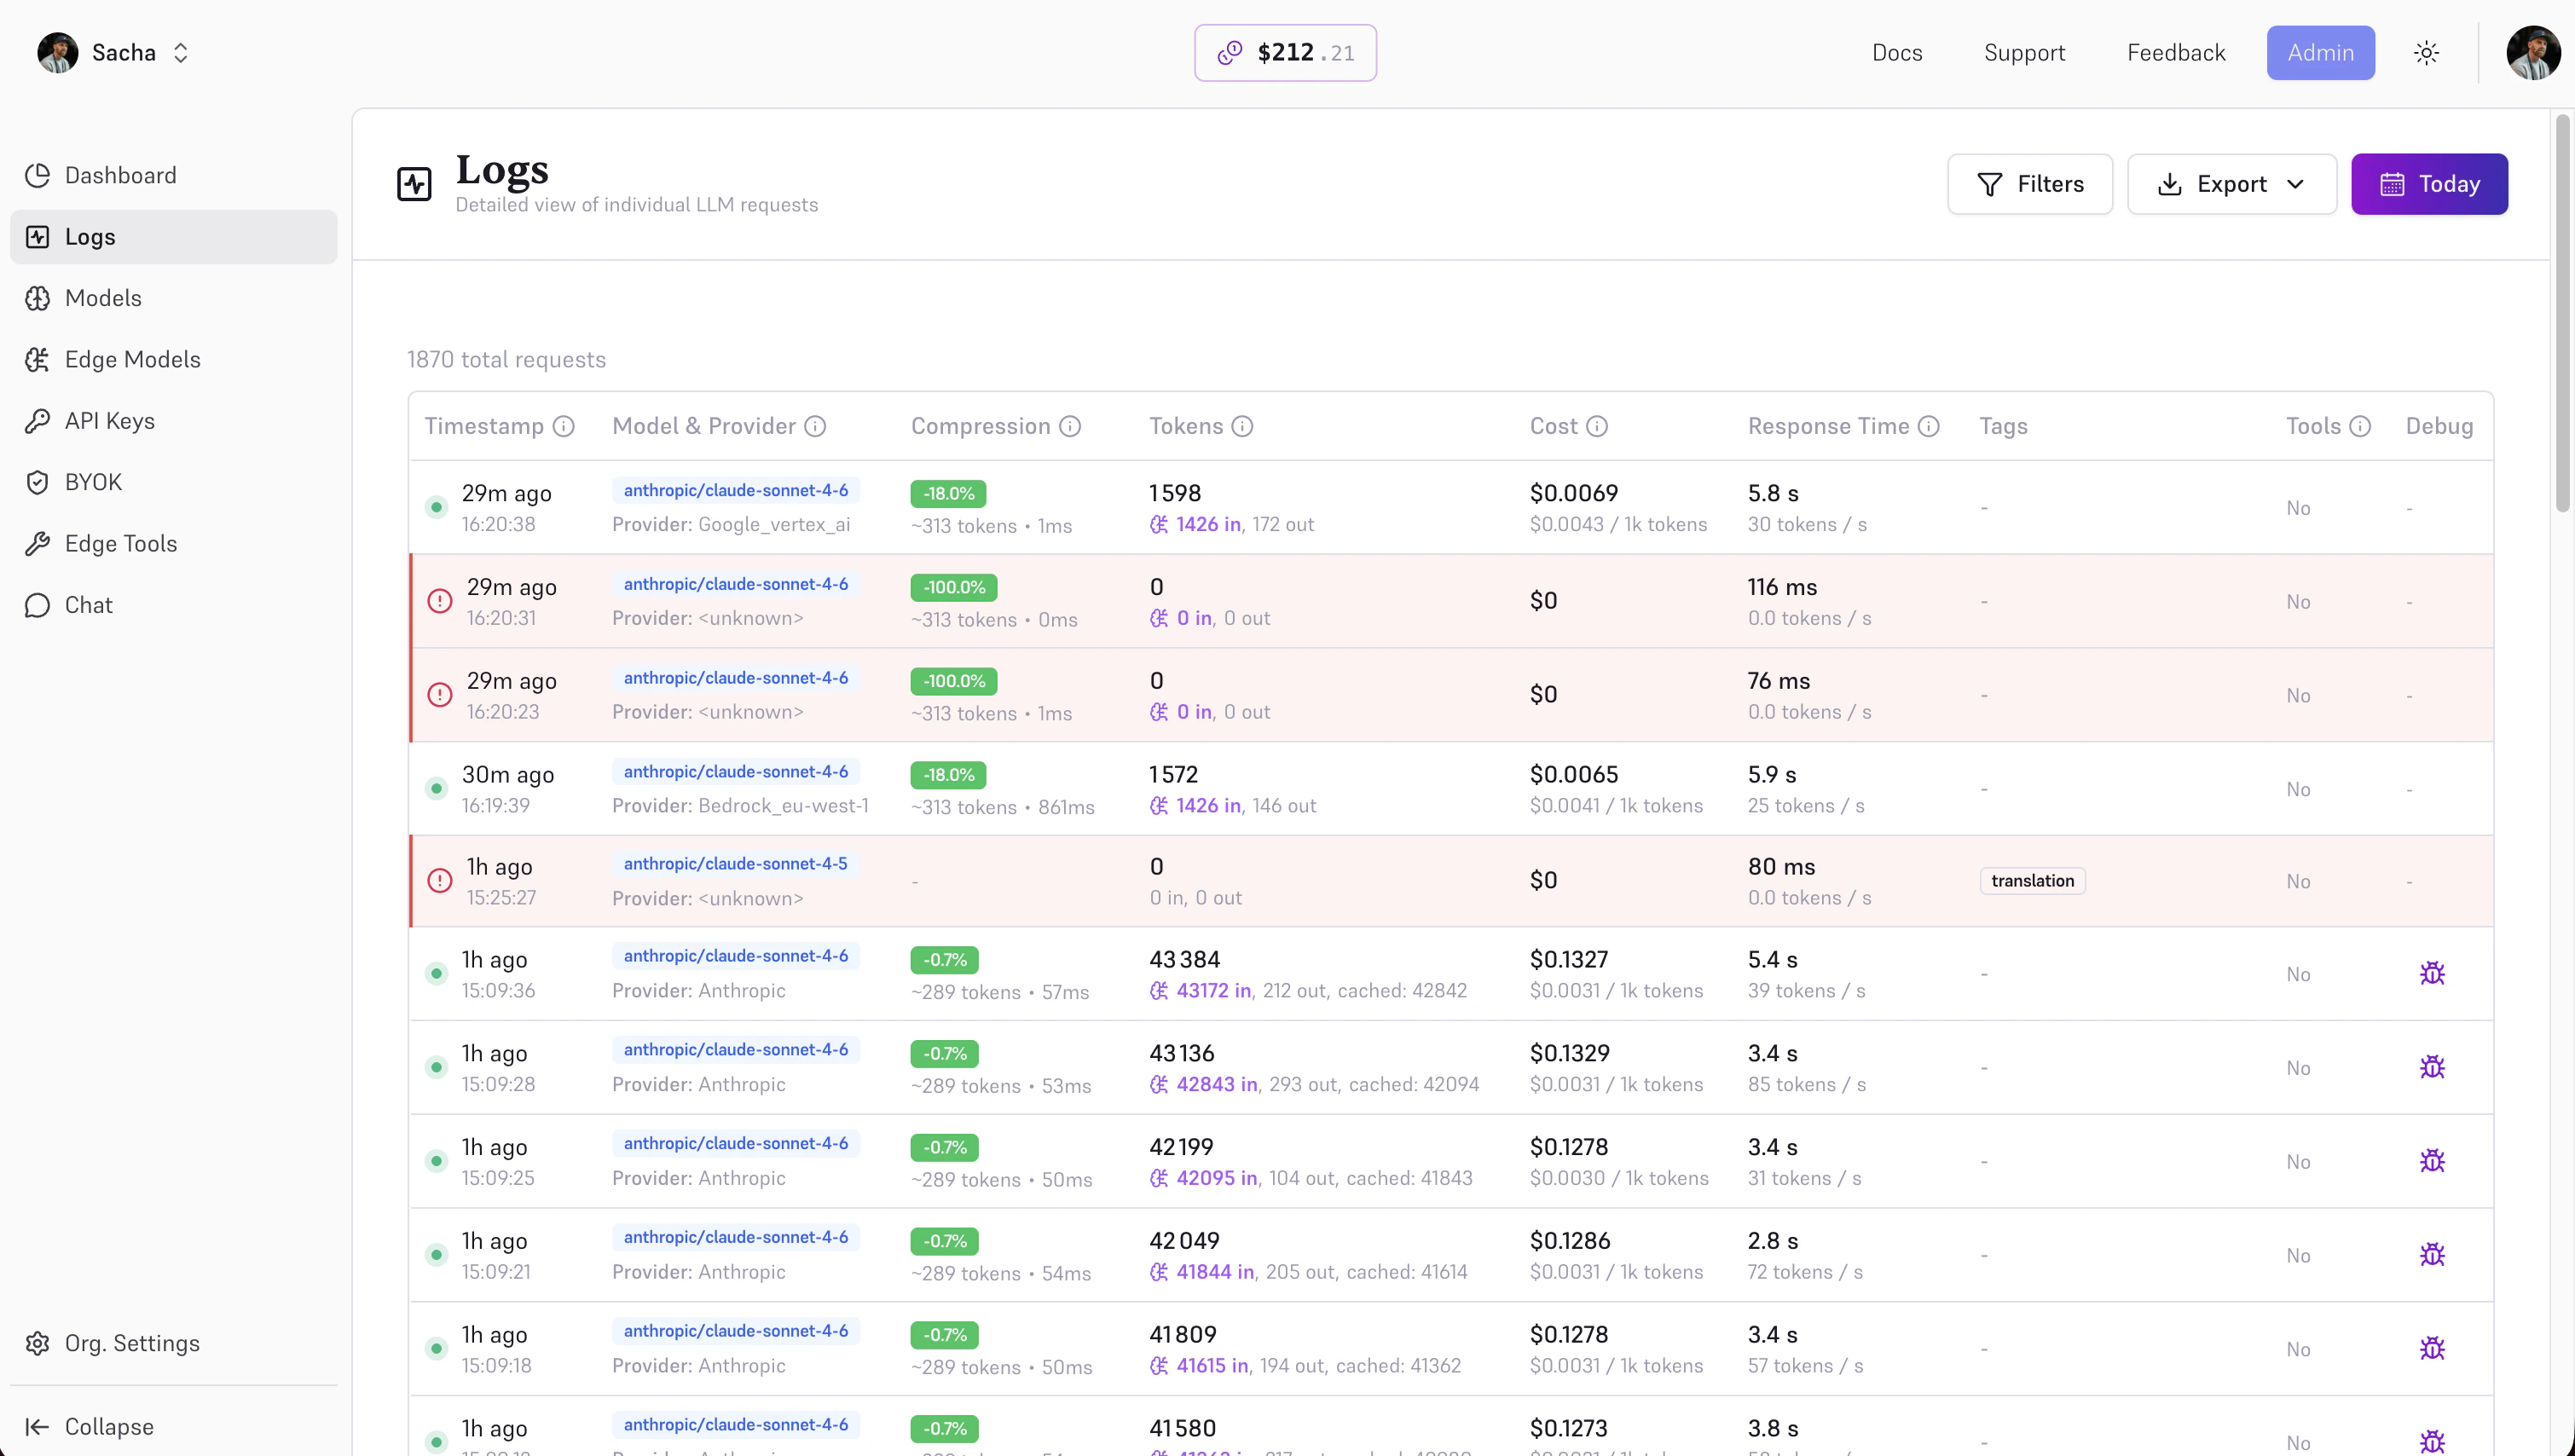
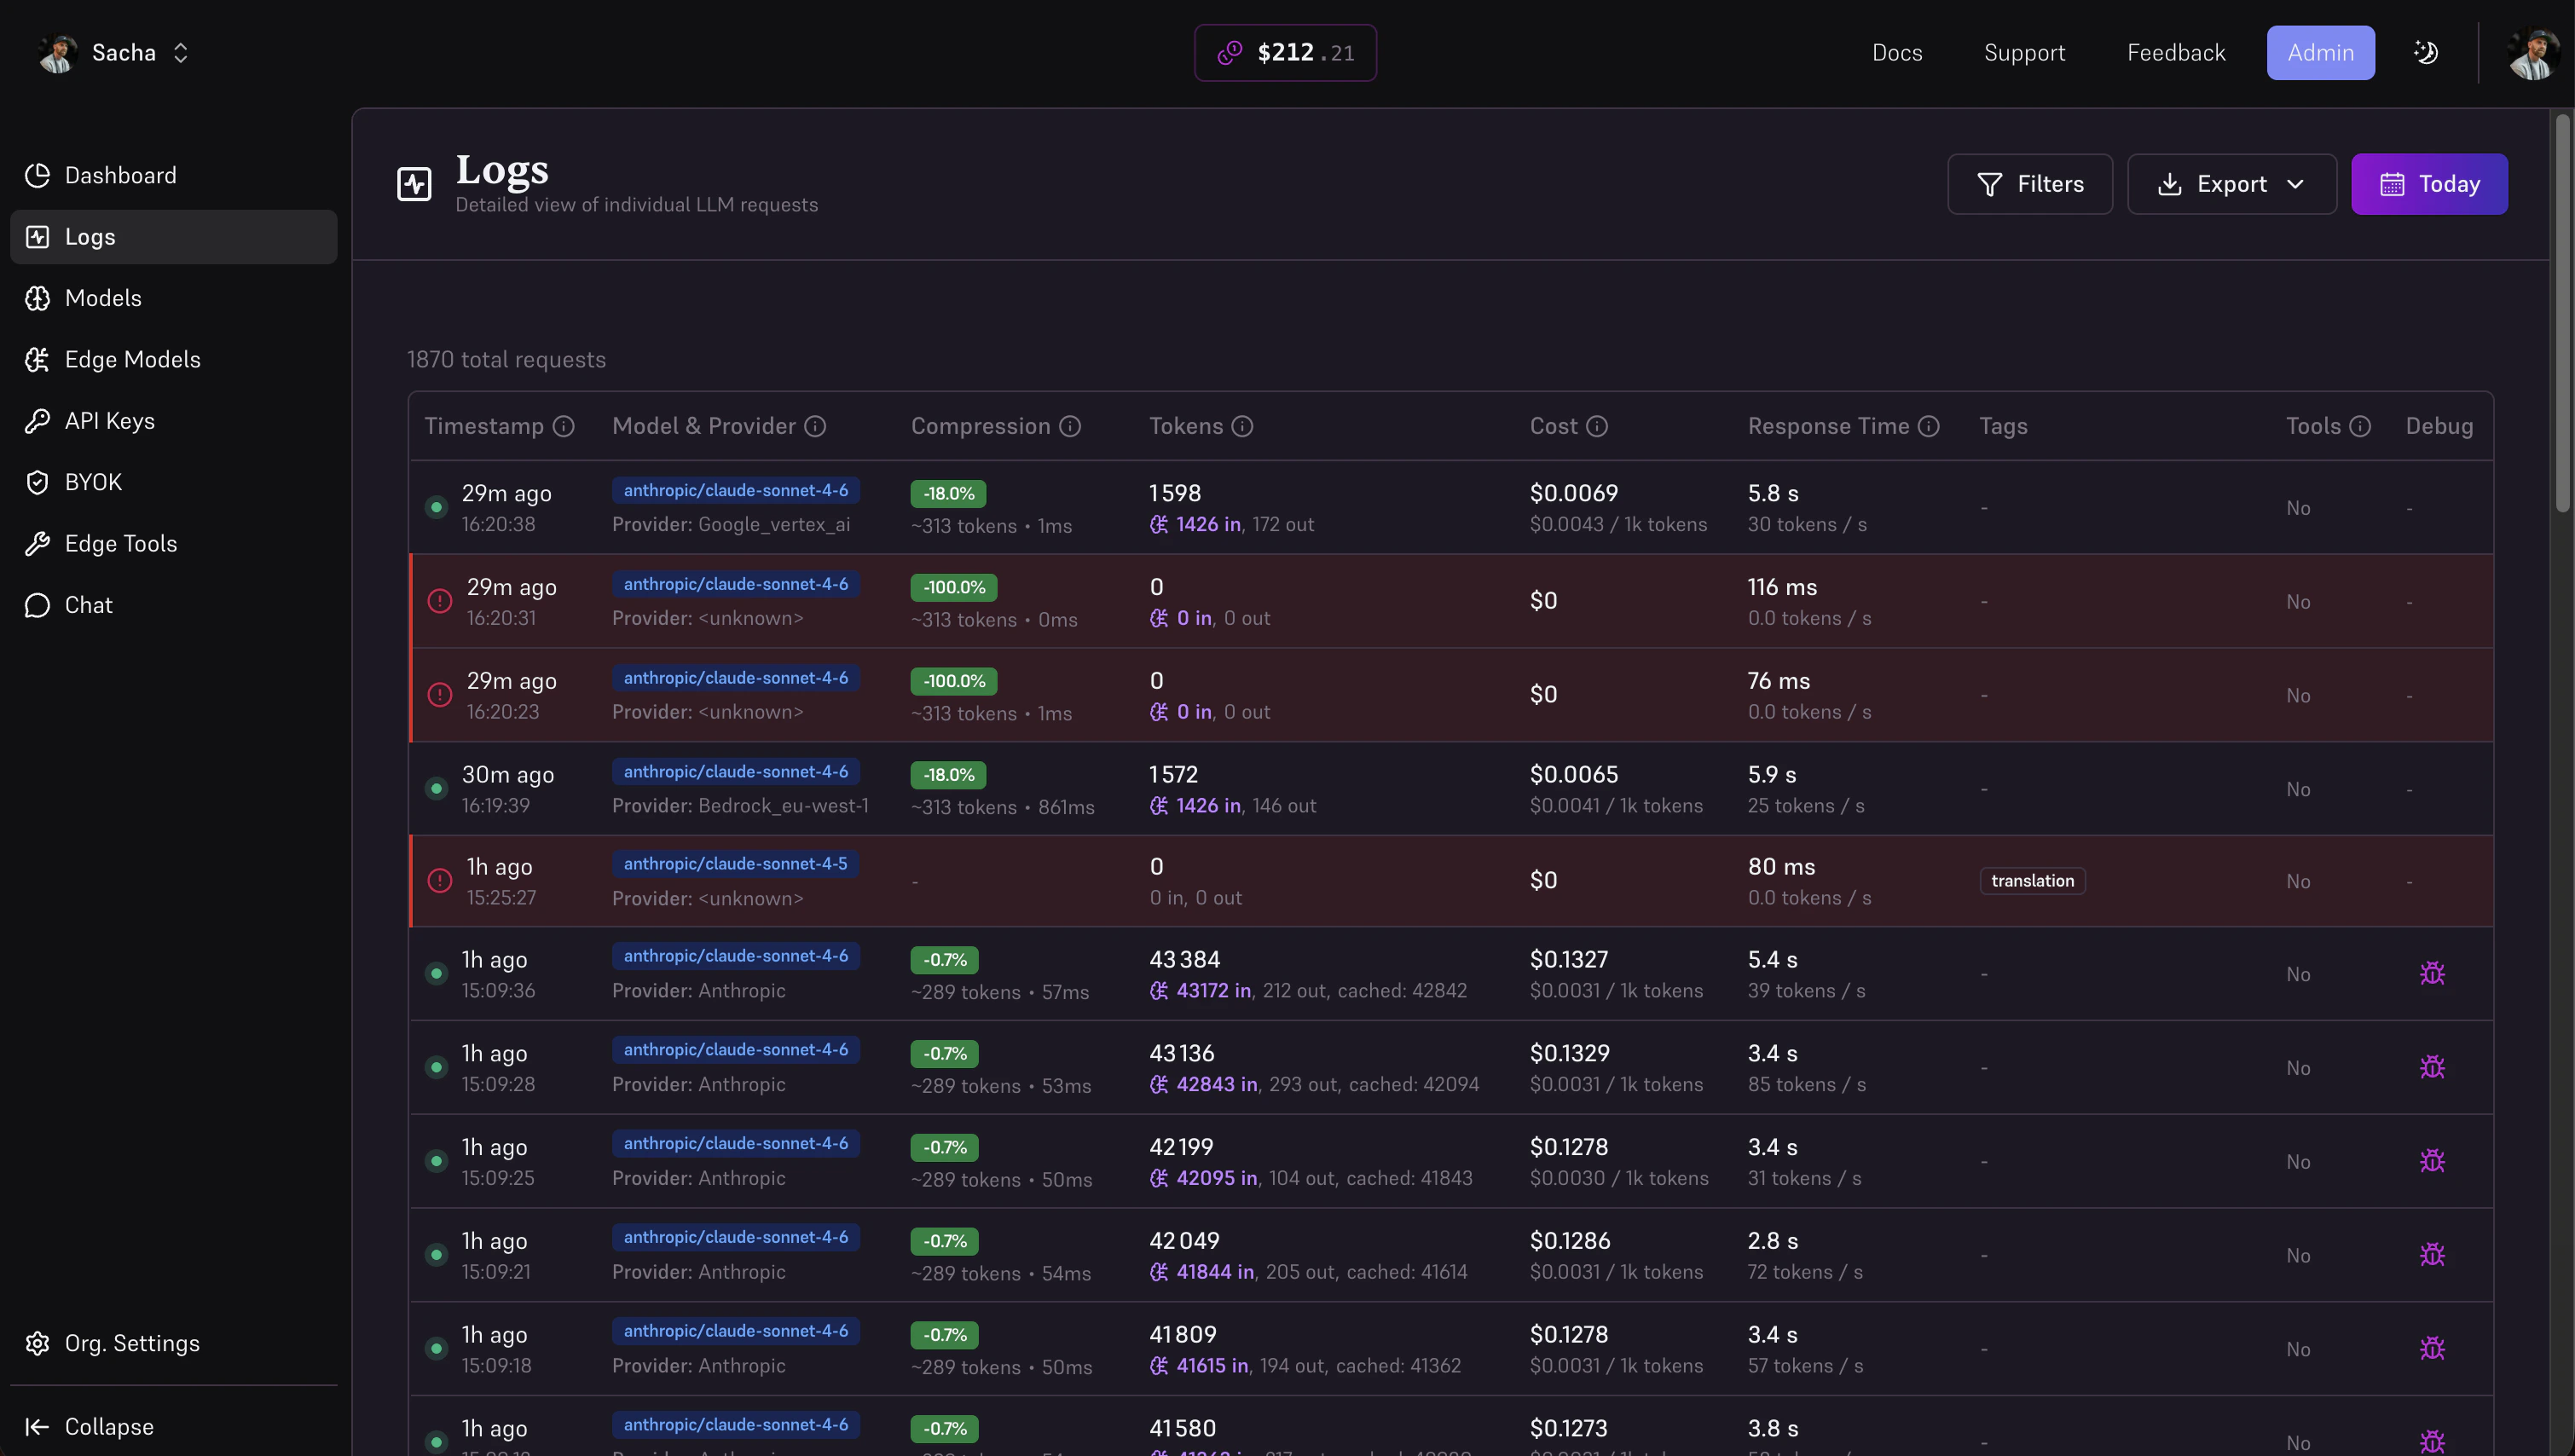
The Logs page lists every request — model, provider, tokens, cost, compression delta, latency, errors. Click into a row to inspect the full request and response payload (when Debug mode is enabled on that key).
Tags allow you to categorize and label requests for filtering and grouping in your analytics dashboard. Add tags to track requests by environment, feature, user, team, or any custom dimension.Using tags in native SDKs:
Using tags with OpenAI/Anthropic SDKs via headers:If you’re using the OpenAI or Anthropic SDKs with Edgee, add tags via the x-edgee-tags header (comma-separated):
OpenAI SDK (TypeScript)
Anthropic SDK (Python)
import OpenAI from "openai";const openai = new OpenAI({ baseURL: "https://api.edgee.ai/v1", apiKey: process.env.EDGEE_API_KEY, defaultHeaders: { "x-edgee-tags": "production,chat-feature,user-123,team-backend" }});
Environment taggingTag by environment: production, staging, development
Feature taggingTag by feature: chat, summarization, code-generation, rag-qa
User/tenant taggingTrack per-user or per-tenant usage: user-123, tenant-acme, customer-xyz
Team taggingOrganize by team: team-backend, team-frontend, team-data
Use tags consistently across your application to enable powerful filtering and cost attribution in your analytics dashboard. You can filter by multiple tags to drill down into specific segments (e.g., “production + chat-feature + team-backend”).