- Total requests: they represent the total number of requests: a request is processed every time your visitors perform an HTTP(s) request through Edgee, including HTML pages, JS/CSS assets, images, and so on.
- Data Collection events: they represent the total number of analytics events collected via Edgee: a data collection event is collected every time your visitors generate an action on your website such as a page view or a custom event like a button click or page scroll.
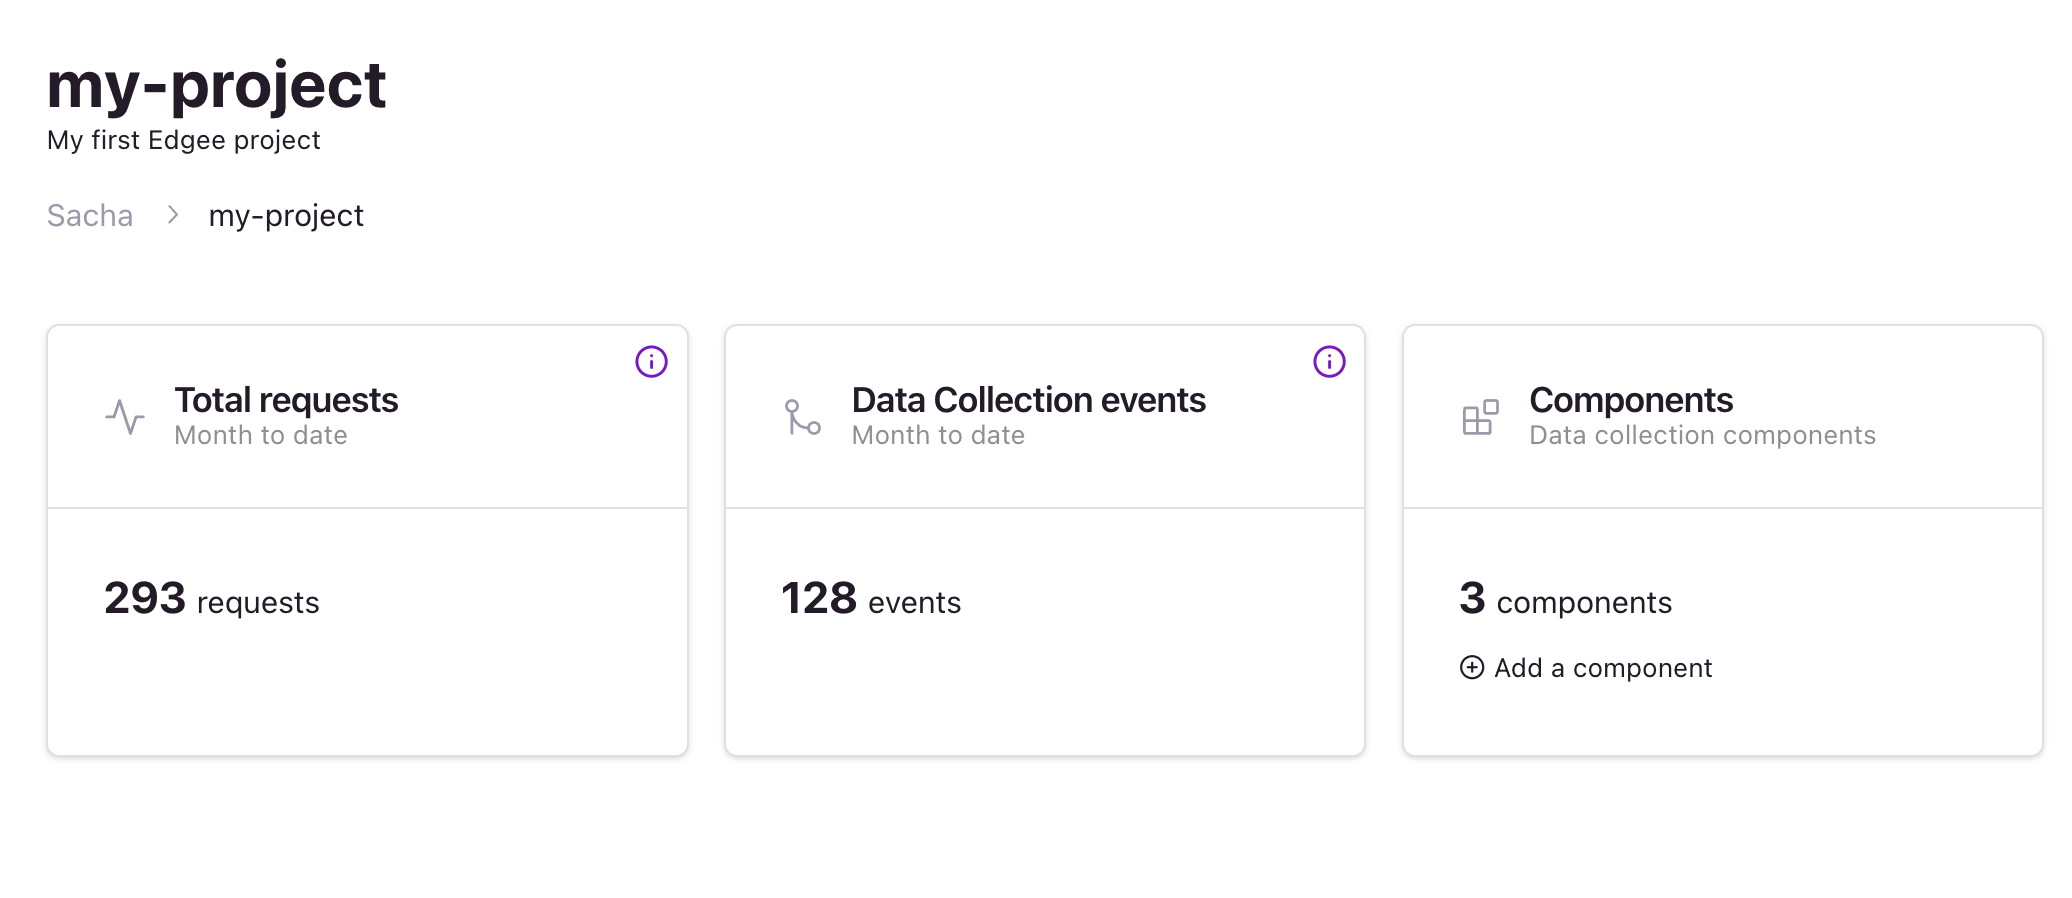
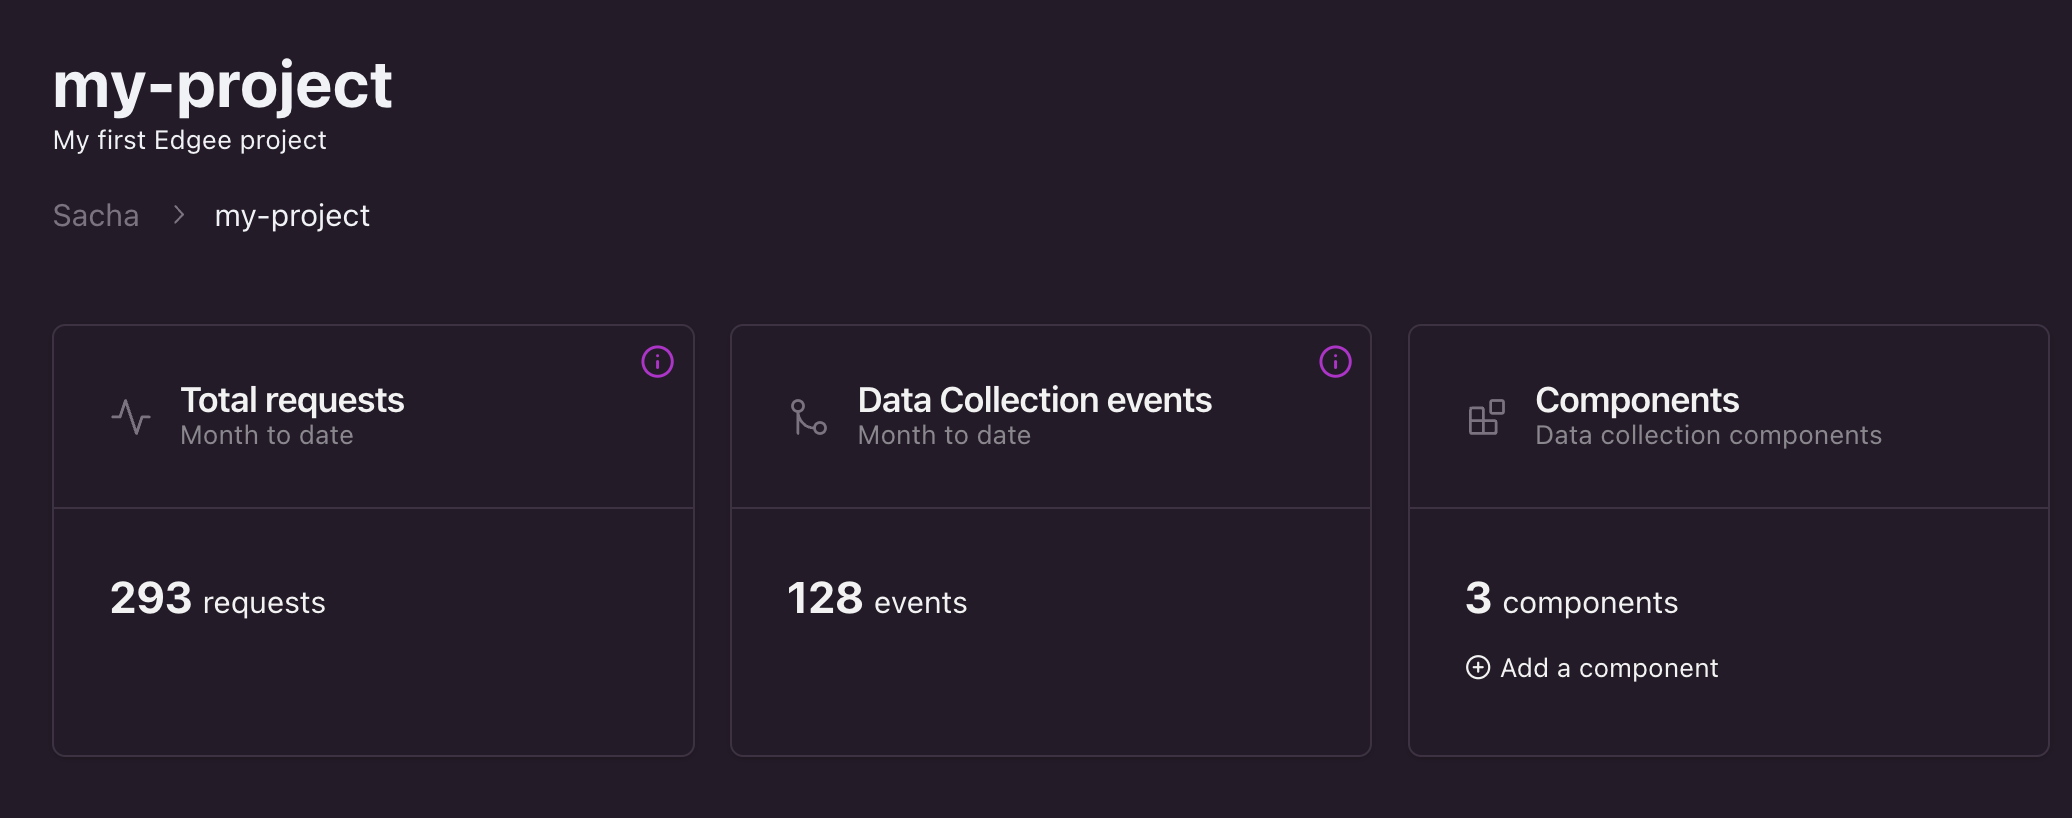
These statistics are updated periodically and represent your monthly consumption up to date.
They will reset automatically at the beginning of each month.