Enable debug mode on an API key
Debug logs are opt-in per API key. By default, Edgee does not store request or response bodies. Enabling debug mode tells the gateway to capture and temporarily retain the full payload for that key. Navigate to API Keys in the console sidebar. In the table, find the Debug column. Click the OFF badge for the key you want to inspect. A confirmation dialog will appear:When debug mode is enabled, full request and response data (including headers, message bodies, and model outputs) is logged and stored temporarily. This data may contain sensitive or personal information and is accessible to all members of your organization. Enable it only when actively debugging.
End-to-end encryption (optional)
By default, debug logs are stored in plaintext and readable by anyone in your organization with access to the console. If a request’s log entry should be readable by nobody but you, not even someone with storage or console access, you can have the gateway encrypt it end-to-end with a passphrase only you hold. Configure the passphrase before runningedgee launch:
EDGEE_DEBUG_LOG_E2EE_PASSPHRASE environment variable is currently shadowing it), then lets you set or clear it. Setting one prompts twice (to catch typos) and stores it in the active profile in credentials.toml; there’s no recovery if you forget it, since debug logs already encrypted to the old passphrase stay unreadable.
The EDGEE_DEBUG_LOG_E2EE_PASSPHRASE environment variable, when set, always takes precedence over the profile setting, useful for CI or a machine where you don’t want the passphrase persisted to disk.
The gateway never holds your passphrase or private key, so it can encrypt an entry but never decrypt one, past or future.
Viewing an encrypted entry: in the debug dialog, an encrypted entry shows a lock icon and a passphrase prompt instead of its content. Enter the same passphrase used at launch time, decryption happens entirely in your browser and the passphrase is never sent to Edgee’s servers. Once decrypted, the entry renders exactly like any other debug log entry.
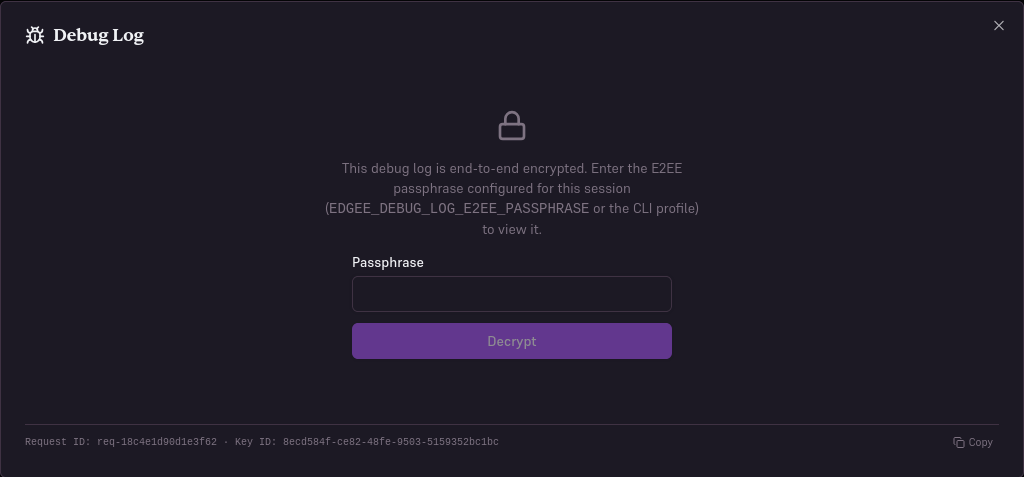
An encrypted debug log entry, prompting for the passphrase before it will decrypt in your browser.
How does the encryption work under the hood?
How does the encryption work under the hood?
The CLI derives an X25519 keypair from your passphrase via Argon2id, then sends only the resulting public key and a salt as headers on every gateway-proxied request for that session. The passphrase and private key never leave your machine.For each debug log entry, the gateway encrypts it to that public key using a fresh, single-use keypair of its own (a sealed-box construction).
View the debug dialog
Once debug mode is on, every request made with that API key will have a bug icon available in the Logs page. Go to Logs in the console sidebar. Each row in the request table represents one LLM call. For requests captured with debug mode, click the bug icon in the rightmost column to open the debug dialog.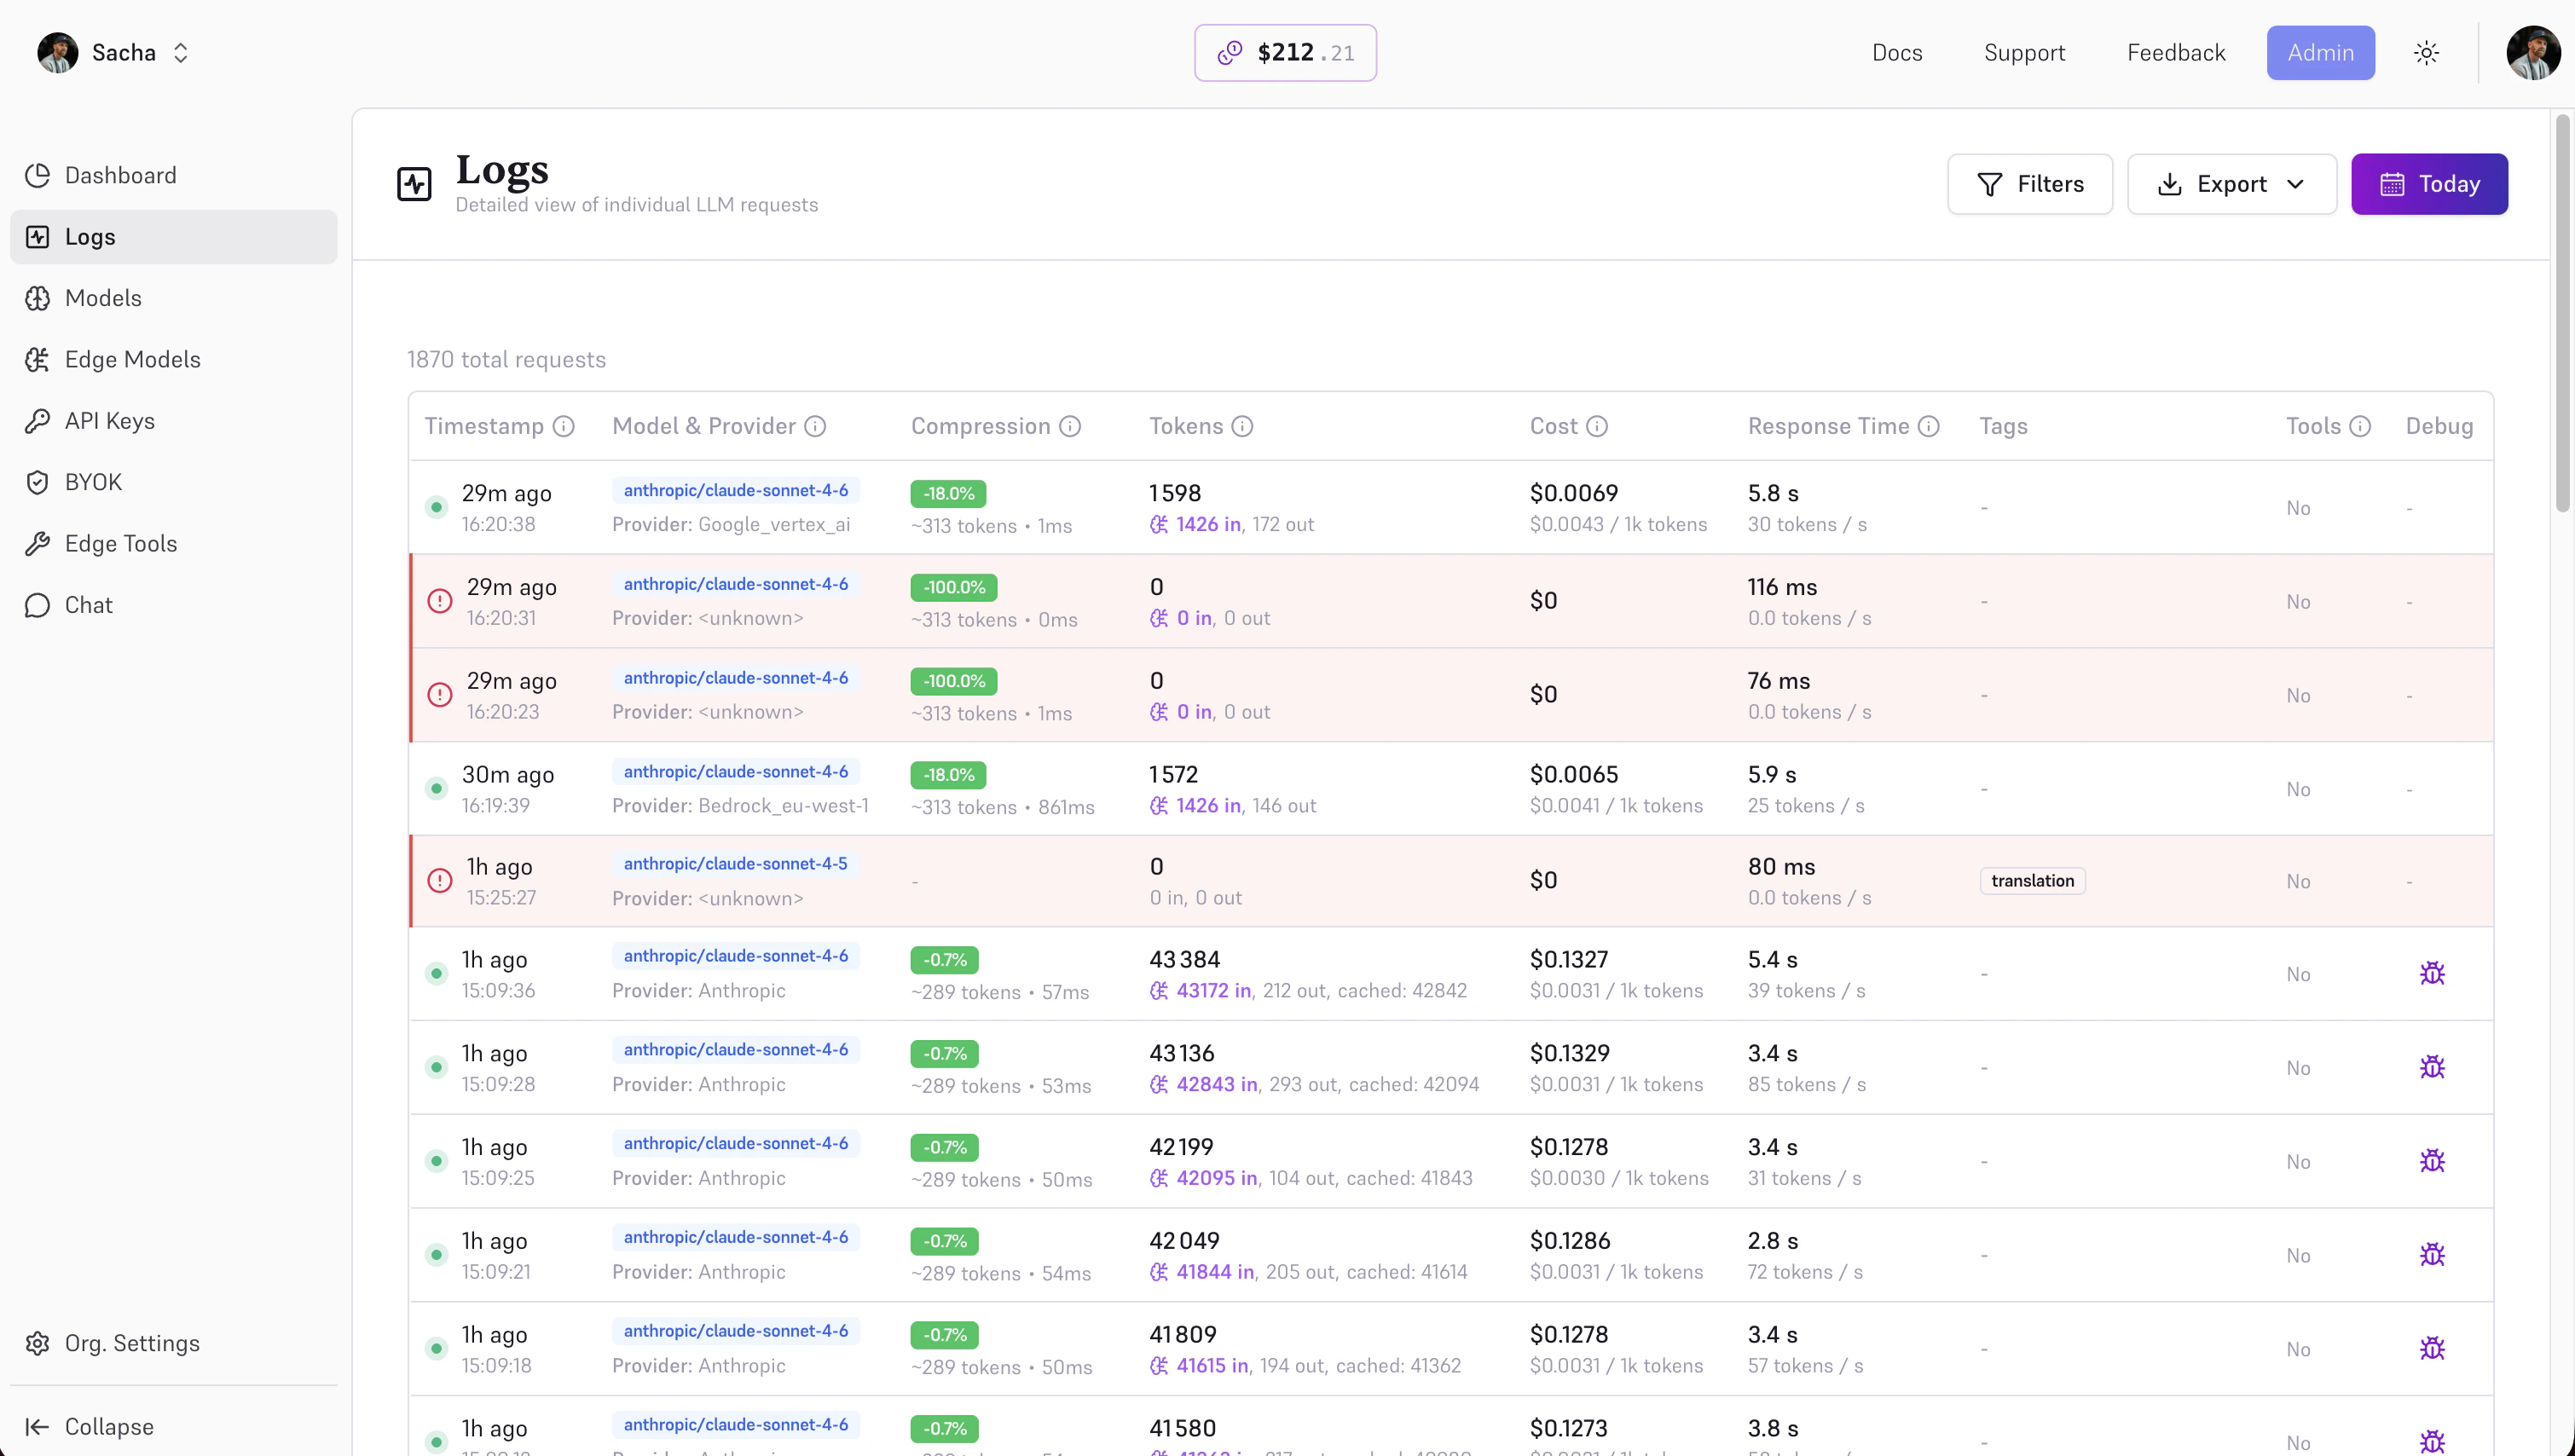
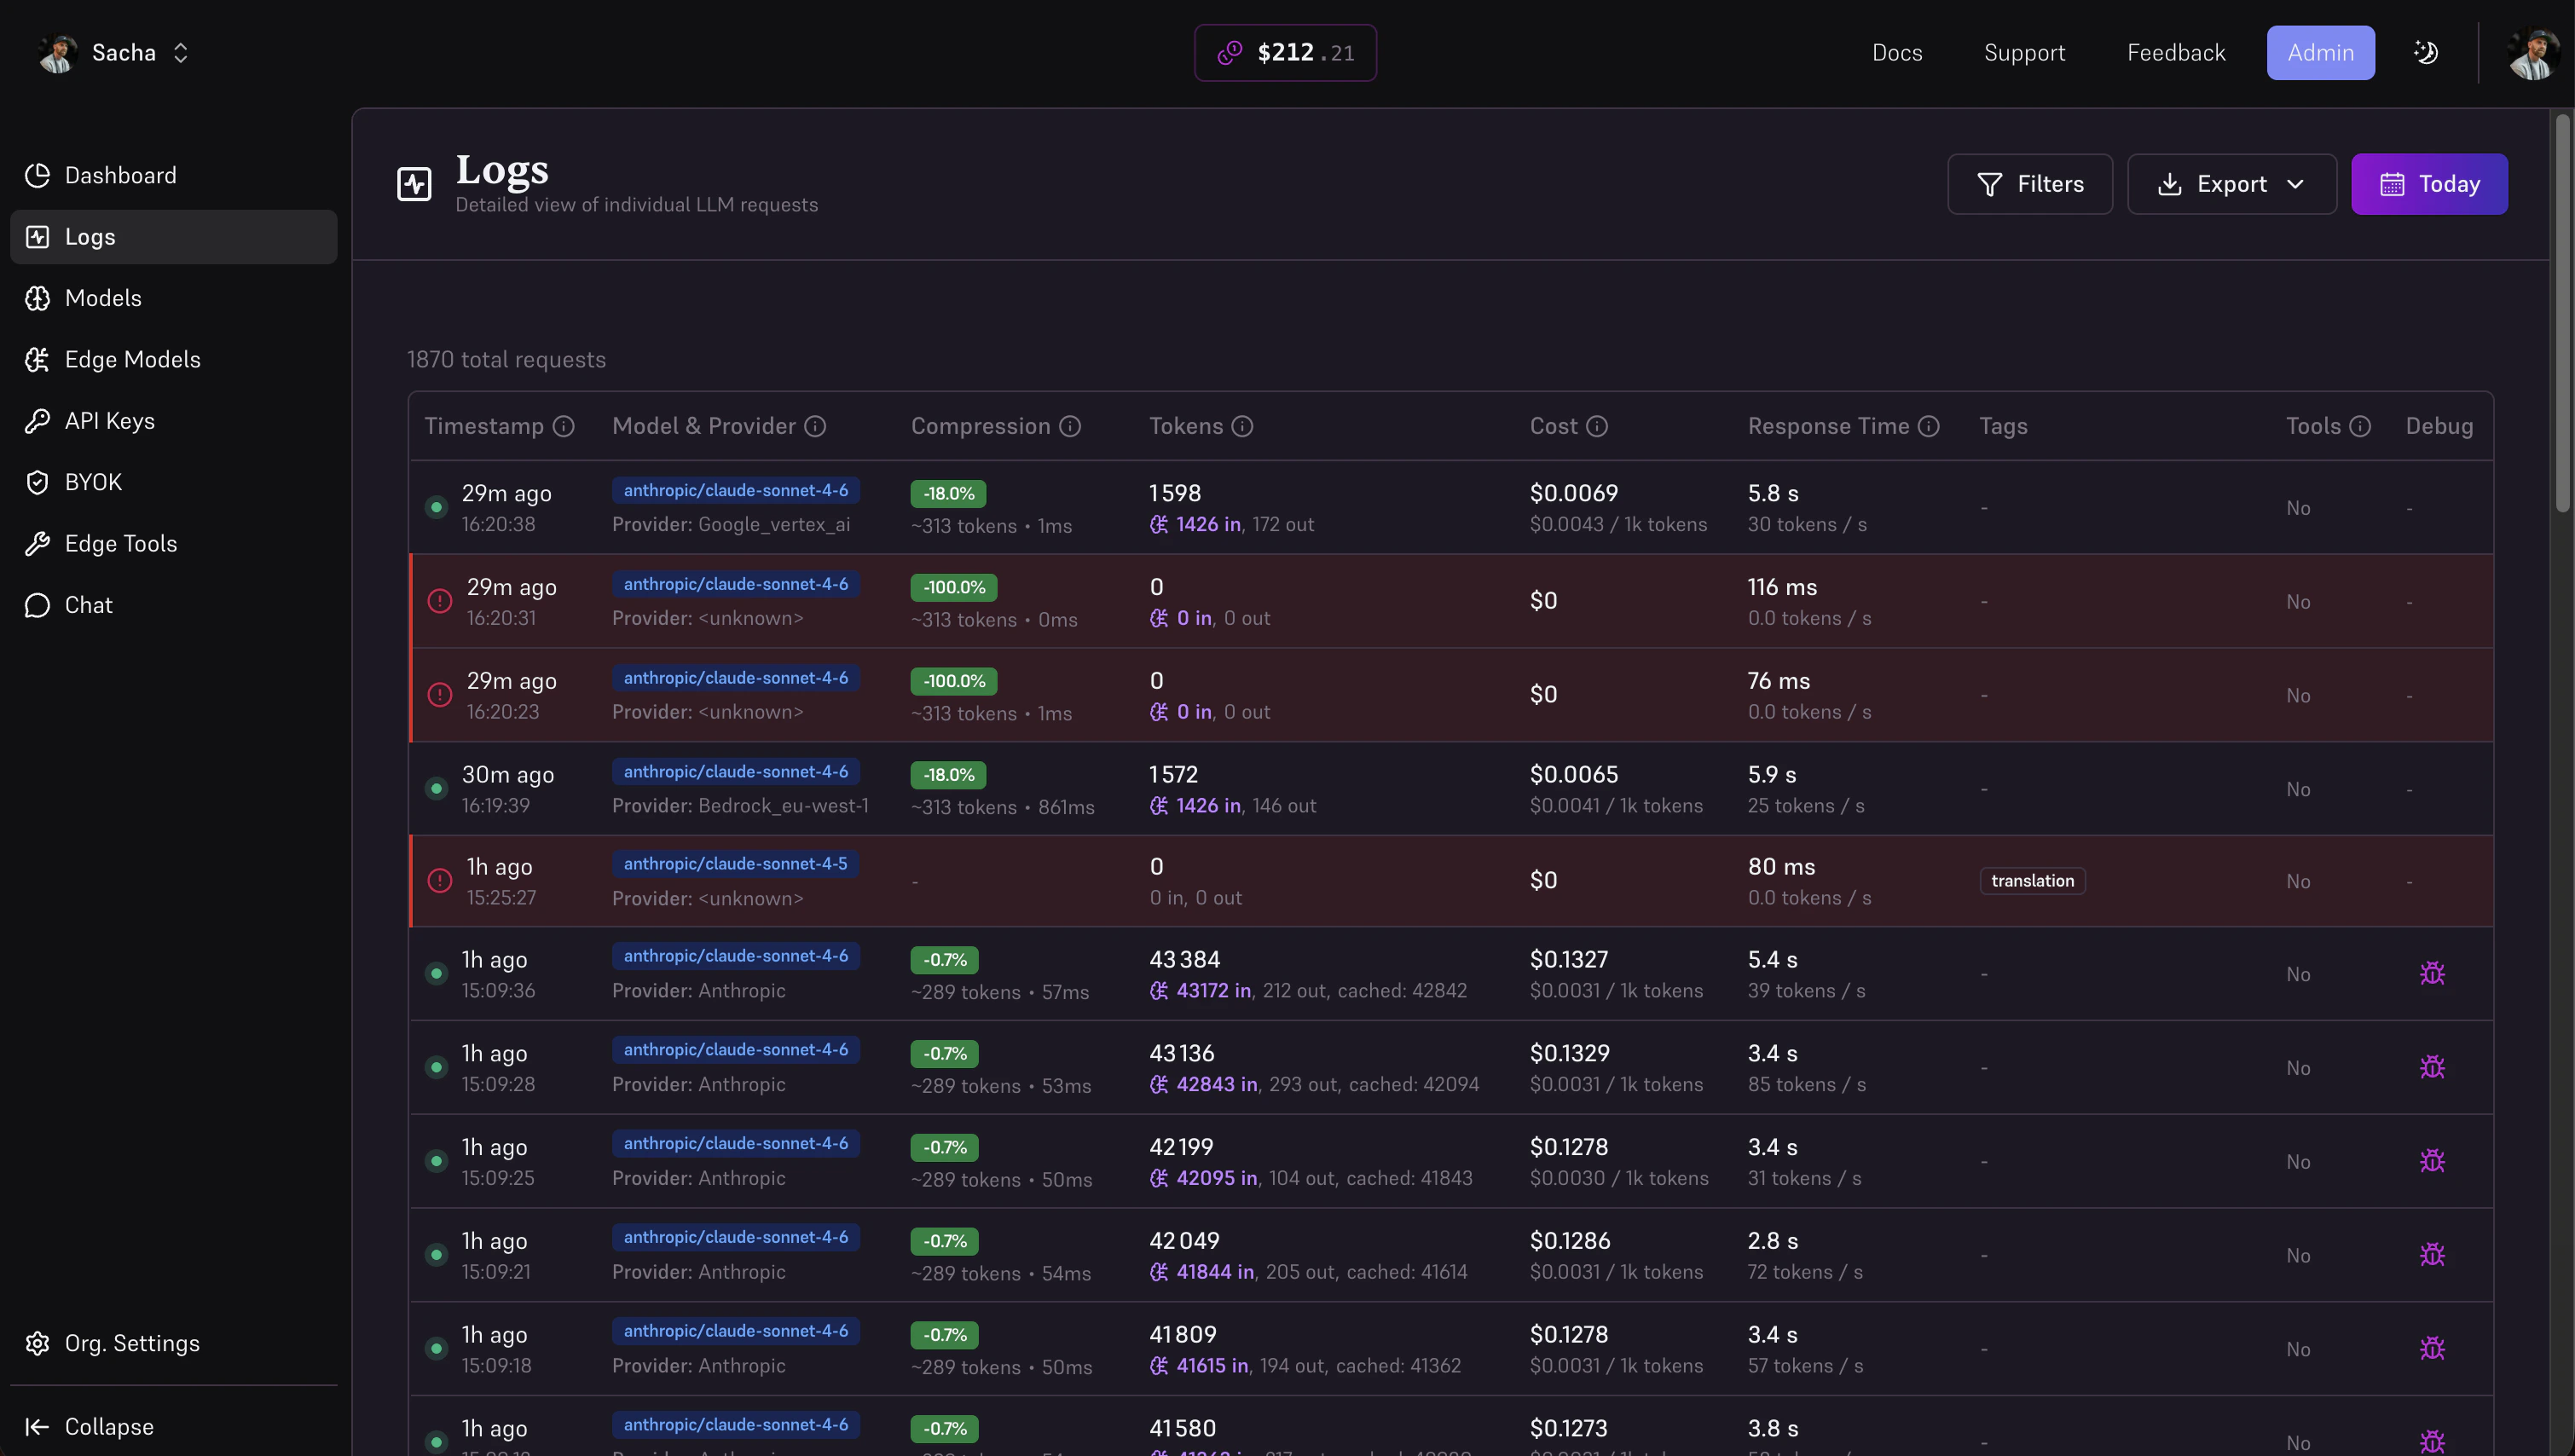
The Logs page, click the bug icon on any debug-enabled row to inspect the full request.
What the debug dialog shows
The dialog opens with full details about that specific request.Metadata
A 3-column grid at the top shows at a glance:HTTP Request
The HTTP Request section (collapsible, open by default) shows everything Edgee sent to the provider. It is organized in tabs:- Full Body: The complete request body as an interactive JSON tree. You can expand/collapse nodes, switch to raw JSON view, and copy the content.
- Headers: All request headers in a key/value table. Sensitive values (such as authorization tokens) are displayed as
[REDACTED]. - Messages: The input messages array extracted from the body.
- Compressed: The compressed version of the messages, shown only when token compression was applied to this request.
- Compare: A side-by-side diff of the original and compressed messages. Each row corresponds to one message by index, so you can see exactly what was changed, shortened, or removed by the compression engine.
Output
The Output section (collapsible, open by default) shows what the provider returned:- Output (Response): The full response body for non-streaming requests, as an interactive JSON tree.
- Output (Accumulated Content): The concatenated streamed content for streaming requests.
- Output (Error): The raw error message in red if the provider returned an error or the request failed.
Request ID
The dialog footer displays the request ID in monospace. Use the Copy button to copy it, useful when filing a support ticket or correlating logs with your application code.Compression comparison in practice
When token compression is active, the Compare tab lets you validate what was actually sent:- Original message in the left column
- Compressed message in the right column
- Messages without a counterpart (e.g. if the array lengths differ) show a dash